Subscribe to Gorilla Grants
We regularly run grants to help researchers and lecturers get their projects off the ground. Sign up to get notified when new grants become available
Are you curious about the timing accuracy of your online experiments?
Online stimulus and response timing is good enough for a wide range of behavioural research. However, there are some quirky combinations to watch out for. We also make recommendations of how to reduce measurement error when timing sensitivity is particularly important.
We have had a paper published that looks at this exact question. It’s out in Behaviour Research Methods, you can read it here. This paper looks at the timing accuracy of experiments run online, not only in Gorilla but in several other popular platforms for behavioural research. It also includes parts of the participant analysis we had shown in a previous blog post. Your participants could be using any number of devices and web browsers, so we wanted to let you know what they are using and also test a few of these types of browser and devices for their impact on stimulus and response timing. We also wanted to assess the performance of a range of experiment building libraries and tool boxes (we’ll put these under the umbrella term ‘tools’).
We tested:
TLDR, The major finding was that – for most users – the timing accuracy is pretty good across all the validated tools. Definitely good enough for the vast majority of studies with within-subject designs. However, there are some quirky combinations you can see in the graphs below.
Before heading into our results, it’s probably helpful to provide the reader with an overview of two concepts: Accuracy and Precision.
Accuracy in this context is the average difference between the ideal timing (e.g. reaction time recorded is the exact moment the participant presses a key) and observed timing. The closer the difference is to zero, the better.
Precision is a related metric, but probably more important in this case (we’ll explain why below). It refers to the variability around our average accuracy.
These two things can vary independently. To illustrate this, we have used a toy example of arrows shot into a target:
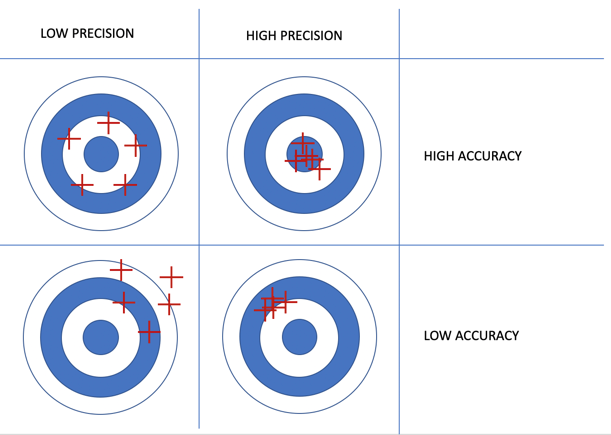
In this example, accuracy is the distance from the bullseye, and precision is the spread of the arrows. In our paper these values being low is better — so a value of zero for accuracy means arrows are spot on the bulls-eye.
It’s clear that the top right target is the best – the archer has shown both high accuracy and precision.
But which is the second best? Is it high accuracy with low precision, even with the arrows being quite a distance from the centre individually – as seen on the top left. Or low accuracy with high precision, a tight cluster of precise arrows but missing the mark — as seen on the bottom right.
In the case of experiment timing it’s the later, lower accuracy with a higher precision, that is arguably preferable.
This is because we are often comparing conditions, so a consistent delay on both conditions still leads to the same difference. Compared with high accuracy, but low precision, where the difference might be obscured. In other words, high precision delivers less noisy data, thereby increasing your chance of detecting a true effect.
We first assessed the timing of the visual elements in the experiments. So how accurate and precise something in a trial would be rendered on the screen.
We assessed the timing of stimuli (a white square) at a range of durations. This was done by presenting the stimulus at 29 different durations from a single frame (16ms) to just under half a second (29 frames). That’s 4350 trials for each OS-browser-tool combination. This means we displayed over 100,000 trials and recorded the accuracy of each of them. This makes this section of the paper the largest assessment of display timing published to date.
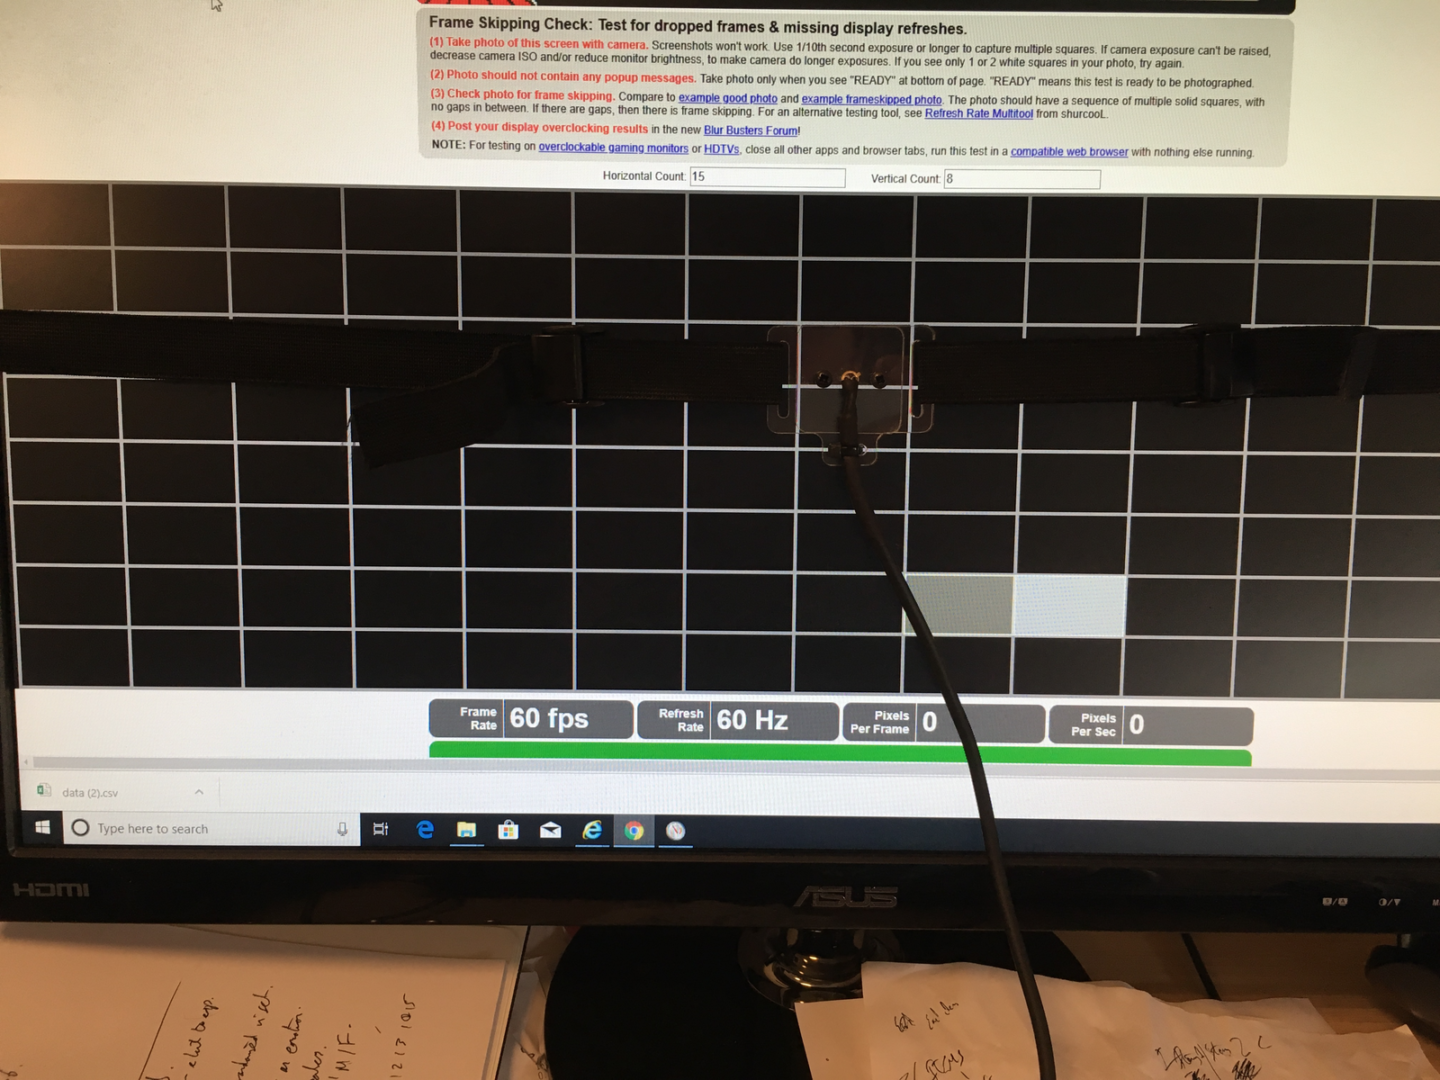
Depicted above is the photo-diode sensor attached to a computer screen. We used this to record the true onset and offset of stimuli and compared this to the requested duration put into the program.
The results of this measurement are broken up in the graphs below:

The dot’s distance from the red line represents accuracy, and the spread of the line represents precision. You can see that there is a variance between browsers, operating systems and tools. Each tool/experiment builder has a combination it performed particularly well on. Almost all of the tools over-presented frames rather than underrepresented them. Except for PsychoJS and Lab.js on macOS-Firefox, where it appears some frames where presented shorter than requested. Under-presenting by one or two frames would lead very short presentations to not be rendered at all. At Gorilla, we believe that presenting stimuli is essential, and therefore each stimulus being shown slightly longer, is a better outcome.
We discovered that the average timing accuracy is likely to be a single frame (16.66ms) with a precision of 1–2 frames after (75% of trials in Windows 10 had 19.75ms delay or less, and 75% of trials on macOS had 34.5ms delays or less).
Reassuringly, the vast majority of the user sample was using the best performing combination – Chrome on Windows. A platform combination that Gorilla performed at highly consistently.
Where our paper has gone beyond any previous research is that we tested a range of frame duration. This is important because you want the accuracy and precision, to remain constant across frame durations. That way, you can be sure that the visual delay (error) at one duration (say 20 frames) is that same as the delay at another duration (say 40 frames). So when you calculate the difference in RT at different stimuli durations, the error cancels out.
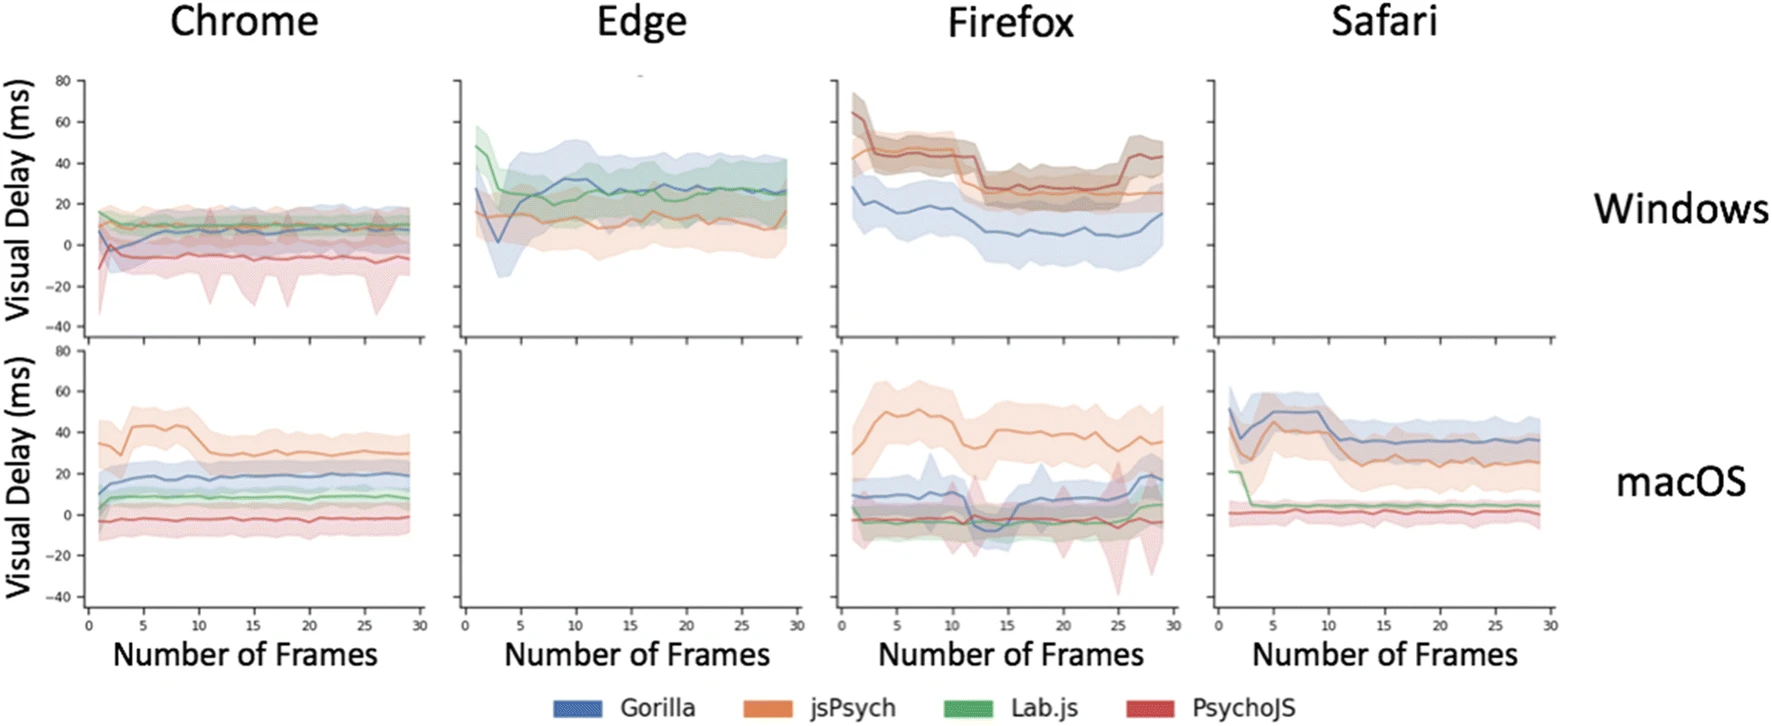
As you can see, there is some variation across display durations. Smooth lines (averages and variance) are better than spiky ones.
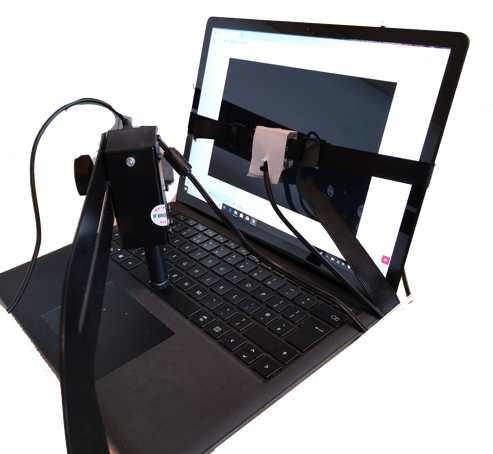
The other key factor to timing in online experiments is how accurately and precisely your responses are logged. You want to be sure your reaction time measures are as close to when your participant pressed down as possible. This introduces the factor of the keyboard – which could be a built-in keyboard on a laptop or an external keyboard on a desktop. Therefore, we widened the number of devices we assessed to include laptop and desktops.
To be sure of the specific reaction time used, we programmed a robotic finger (called an actuator) to press the keyboard at a specific time after a stimulus had been displayed. This replicates the process a human would go through, but with much less variability. We programmed the finger to respond at 4 different reaction times: 100ms, 200ms, 300ms & 500ms – representing a range of different possible human reaction times. These were repeated for each software-hardware combination 150 times.
You can see a picture of the set-up above on a laptop, the photo-diode senses the white square and then the actuator presses the space bar.
You can see the results below. The Reaction Time latencies we report, averaging around 80ms and extending to 100ms sometimes, are longer than other recent research reported (Bridges et al., 2020).
We believe that this is because previous research has used things like a button box (a specialist low-latency piece of equipment for lab testing of RT), and differences in the setting up of devices (that can vary pretty drastically in terms of keyboards). The actuator set up allowed us to report variance that is contributed by the keyboard, something that is important for users to know about as their participants will be using a variety of keyboards.
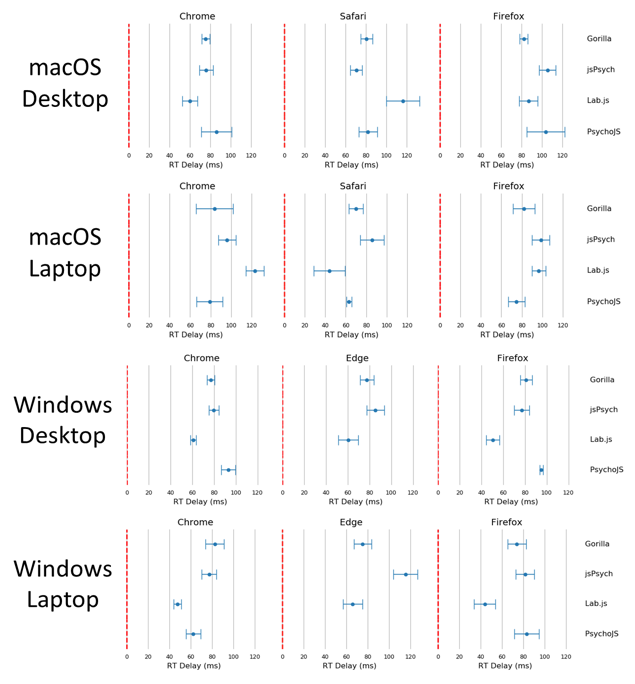
In any case, in terms of precision Gorilla here performs fairly consistently across all platforms and browsers. It had the lowest standard deviation (i.e. highest precision) out of all the platforms – averaging 8.25ms. In general, there was higher variability on laptops relative to desktops.
Again, we find all platforms have some variability across devices and browsers – which seem to be pretty idiosyncratic. For instance, PsychoJS shows relatively high variability with Firefox on the macOS desktop, but fairly average performance on the same browser and OS but on a laptop.
Our results show that the timing of web-based research for most popular platforms is within acceptable limits. This is the case for both display and response logging. However, response logging shows higher delays. Encouragingly, the most consistent combination of Chrome-Windows for all tools was also the most used in our sample survey.
However, when timing sensitivity is crucial, we recommend employing within-participant designs where possible to avoid having to make comparisons between participants with different devices, operating systems, and browsers. Additionally, limiting participants to one browser could remove further noise. Limiting participants’ devices and browsers can be done programmatically in all tested platforms, and via a graphical user interface in Gorilla.
Further Reading
For more in depth reporting, please read our paper: https://doi.org/10.3758/s13428-020–01501‑5
Notes: All platforms are continually under development, so we tested all platforms between May and August 2019 in order to be as fair as possible.
Research by Dr Alex Anwyl-Irvine

We regularly run grants to help researchers and lecturers get their projects off the ground. Sign up to get notified when new grants become available